
How to Analyze Questionnaire Data Using SPSS: A Simple Guide
SPSS analysis of questionnaire data is important in understanding the information you’ve collected from your surveys. Using SPSS, you can easily organize and interpret the data to gain meaningful insights. This will be a simple walk-through of the process to analyze questionnaire data using SPSS. We will also address common inquiries such as the process of analyzing data obtained from questionnaires and the types of statistical analysis employed in these surveys.
An example of how to analyze questionnaire data using SPSS
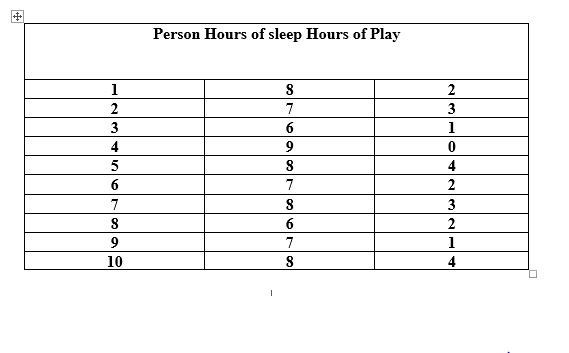
Suppose you administered a questionnaire to 10 people asking them how many hours they sleep and how many hours they play outside in a day. The results could potentially yield the following data:
 Step 1: Insert data into SPSS.
You would input this data into SPSS, as shown in the table above.
Step 2: Compute for the Mean
You could use SPSS to find the mean for the hours of sleep and the hours of play. For example:
- Average hours of sleep: 7.5 hours
- Average hours of play: 2.5 hours
Step 3: Determine the relationship between sleep and play.
Now, you can determine whether individuals who sleep more also play more. SPSS can assist in this by performing a statistical test to determine if there is a relationship between these two.
Step 4: Create a Graph
SPSS can also produce graphs, such as scatter plots or bar charts, to make sense of the data. For instance, we could use a scatter plot to show that people who sleep more hours are more likely to play more hours.
What is a questionnaire?
A questionnaire is a list of questions used to gather information from people. You can ask questions about opinions, behaviors, or preferences, among other measurable things. Once you have the results, you’ll likely want to interpret the answers, drawing meaning from the data.
What is SPSS and how does it apply to the analysis of questionnaires?
SPSS for questionnaire analysis is a tool that will help you manage and understand your survey data. It does much more than just count answers; it calculates averages, creates charts, and tests whether relationships between answers are meaningful. SPSS thus gives you the possibility of viewing your data in many ways and consequently making informed decisions based on the answers.
What is SPSS used for in survey analysis?
SPSS is used for many things in the data analysis of questionnaires, including:
- We arrange the data in an easily readable format.
- We are conducting statistical tests to identify patterns.
- We create graphs and other charts to simplify the understanding of the results.
- We are verifying the dependability of the questionnaire by examining the consistency of the responses.
How can we analyze the data collected from questionnaires?
Here are some straightforward steps using SPSS to analyze the data you collect from a questionnaire:
Step 1: Data Entry
First, you enter your data in SPSS: you can type the answers directly into SPSS, or, if you prefer, you can import the data from a file such as Excel or CSV.
Step 2: Cleaning the Data
Once you’ve entered the data into SPSS, you need to clean it up by checking for any errors, such as missing or incorrect responses.
Step 3: Descriptive Statistics
Next, you could use descriptive statistics to summarize the data. For instance, you could have SPSS compute the mean (average), median (middle value), and mode (most common value) for each question.
Step 4: Inferential Statistics
You can also use inferential statistics to find relationships between answers. For instance, you could use SPSS to help you find out if people who sleep more also tend to exercise more.
Step 5: Measure Reliability
Finally, SPSS can verify questionnaire reliability to ensure consistent answers.
How do you analyze your data in the SPSS PDF?
After performing data analysis, you may want to share your findings. SPSS makes it simple to export your analysis to a PDF. To do this:
- Run your analysis in SPSS.
- Once the output window displays the results, click on “File” at the top.
- Select “Export,” and choose “PDF” as the file format.
- Once you save the file, you can share your SPSS analysis in a PDF format.
This will help you present your results in a readable and professional document.
How Do You Write a Questionnaire Analysis?
A questionnaire analysis involves writing about what you have found in the data. The steps for writing it are as follows:
-
Introduction
Introduction: Include a statement of purpose for the questionnaire. For instance, “We designed this questionnaire to understand how many hours people sleep each night.”
-
Data Overview
Present the basic results from the questionnaire. This consists of the mean, median, and mode for every question. You could also discuss any intriguing patterns you noticed.
-
Statistical Analysis
After describing the basic results, discuss any statistical tests you’ve performed. For example, if you have compared how much people sleep to how much they exercise, describe the test you used and what the results mean.
-
Interpretation of Results
Interpret the results by telling what they mean. For example, “The average number of hours people sleep each night is 7.5 hours, and those who sleep more also tend to exercise more.”
-
Conclusion
Conclude with a conclusion that identifies the important findings and recommends any next steps or further actions based on the outcomes.
What statistical analysis is used for questionnaires?
Numerous forms of statistical analysis exist to identify patterns and connections in questionnaire data. Descriptive statistics, such as determining the mean, median, and mode of a set of answers, are among the most commonly used statistical analysis methods. Others include:
- Descriptive statistics involves determining the mean (average), median (middle value), and mode (most frequent answer).
- T-tests: A comparison between the mean responses of two groups.
- ANOVA: A comparison between the averages of more than two groups.
- Chi-square tests: These look at the relationship between categorical data.
- Correlation: This test looks at the relationship between two variables, for example, hours of sleep and exercise.
SPSS makes it very easy to run these tests with just a few clicks.
How do you measure the reliability of a questionnaire in SPSS?
The importance of calculating the reliability of a questionnaire lies in proving that its results repeat themselves. One such measure is Cronbach’s Alpha in SPSS, which would indicate how reliable a questionnaire actually is.
Steps to Measure Reliability:
- In SPSS, choose the “Analyze” > “Scale” > “Reliability Analysis” menu item.
- Transfer the questions for reliability testing.
- Further, select Cronbach’s Alpha in the method dialogue box.
- SPSS will calculate the reliability and give you a score. Typically, we accept a score above 0.7 as reliable.
How do you analyze quantitative data from a questionnaire?
Quantitative data are numbers that can be measured, e.g., how many hours a person sleeps or how many hours they play outside. SPSS can analyze quantitative data in the following ways:
- You are directly typing the numbers in SPSS.
- Using the descriptives to get the mean and others.
- Apply inferential statistics to identify patterns, such as whether individuals who sleep more tend to be more active.
- You can create graphs and charts to help visualize the data.
With these steps, you can easily analyze the quantitative data arising from your questionnaire and derive insights.
Conclusion: Why SPSS is Essential for Questionnaire Analysis
In this article, we showed how one can analyze questionnaire data using SPSS. Be it the use of descriptive statistics in summarizing data, measuring reliability, or running statistical tests, SPSS makes understanding what your questionnaire answers mean very easy. By using SPSS for survey data, you can make more informed decisions and draw conclusions supported by reliable data.